
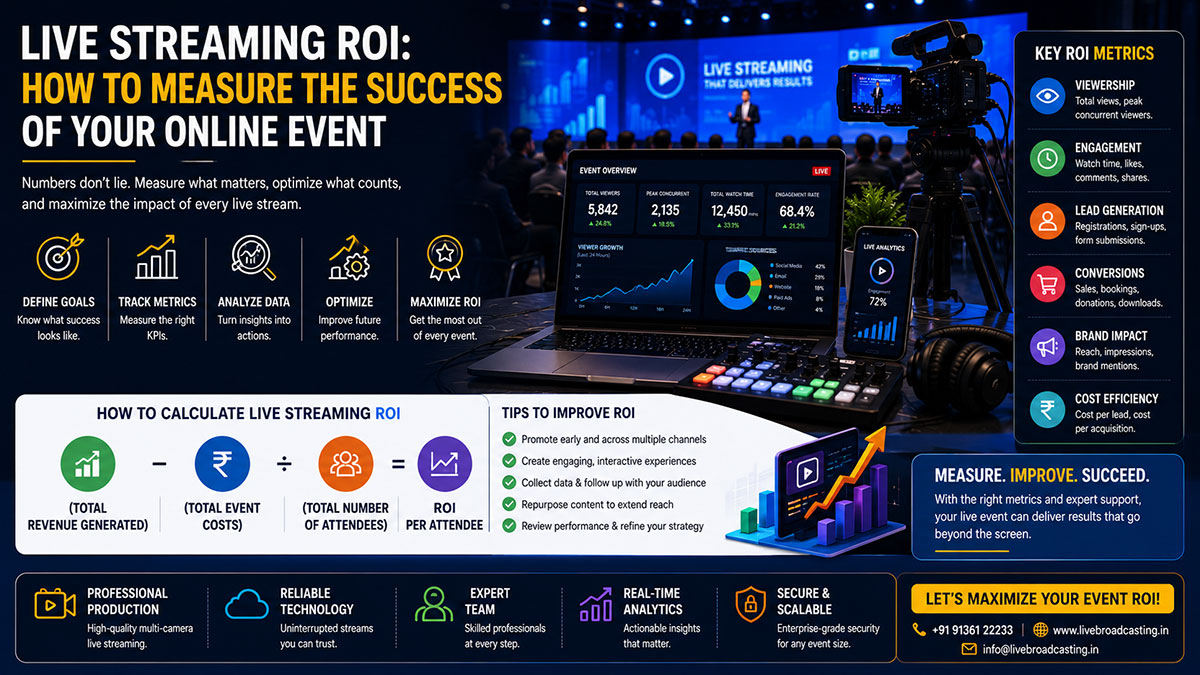
Budget approval for a live streaming production often comes down to a single question: what is the return on investment? Marketing managers, event directors, and communications teams know intuitively that reaching more people is valuable. But in a world where every line of expenditure requires quantified justification, ‘we reached a bigger audience’ is not enough.
Defining ROI for Different Event Objectives
- Corporate communications events — ROI metric: cost per employee reached multiplied by communication effectiveness
- Sales and commercial events — ROI metric: leads generated, qualified leads, and revenue influenced
- Brand and marketing events — ROI metric: reach, sentiment, media coverage, and social engagement
- Educational and training events — ROI metric: completion rates, assessment scores, and downstream behaviour
The Core Metrics Framework for Live Streaming Analytics
Audience Size Metrics
- Peak concurrent viewers — the maximum number of people watching simultaneously
- Total unique viewers — the total number of distinct individuals who watched any portion of the stream
- Total view hours — the sum of all viewing time across all viewers
Engagement Metrics
- Average watch time — the mean duration that viewers spent watching, expressed as a percentage of total event duration
- Drop-off points — a timeline chart showing at what moments in the event viewers stopped watching
- Poll and Q&A participation rates — for interactive events, the percentage of viewers who participated
Audience Quality Metrics
- Geographic distribution — where viewers were located
- Device split — what proportion of viewers watched on desktop, mobile, or tablet
- Registration-to-viewer conversion — of the people who registered, what proportion actually watched
Calculating Financial ROI for Live Streamed Events
The Cost Avoidance Model
For corporate events where the alternative is flying attendees to a physical venue, cost avoidance is one of the most powerful ROI arguments. Example: 500 remote attendees saved from travelling to a conference. Average travel and accommodation cost of Rs.15,000 per person. Total avoidance: Rs.75,00,000. Streaming production cost: Rs.2,50,000. Net saving: Rs.72,50,000.
The Reach Multiplier Model
Calculate the cost per impression or cost per qualified contact through the live stream and compare it against alternative marketing channels. A well-produced event stream reaching 5,000 target audience members at a production cost of Rs.3,00,000 represents a cost per contact of Rs.60 — typically far lower than equivalent paid media.
Post-Event Content ROI — The Long Tail
The recording, made available on demand after the event, often accumulates as many or more views as the live stream over the following weeks and months. A professionally produced event recording can be edited into session highlights, speaker clips, and promotional content, generating months of social media posts, email newsletter content, and sales enablement material.
Building a Post-Event Analytics Report
Every professional streaming production should conclude with a post-event analytics report covering: total and peak viewership figures, average watch time and completion rate, geographic and device distribution, engagement metric summary (polls, Q&As), comparison against previous event benchmarks, and recommendations for next time.
Frequently Asked Questions
Q: What analytics does a professional streaming platform provide?
Professional platforms provide peak concurrent viewers, total unique viewers, total view hours, average watch time, geographic distribution, device split, drop-off timeline, and post-event on-demand analytics.
Q: How does live streaming ROI compare to traditional event marketing ROI?
For events with large intended audiences but limited physical capacity, live streaming ROI typically exceeds traditional event marketing by reaching more targeted audience members at a lower cost per contact.
Q: What is a good average watch time for a corporate live stream?
For a corporate keynote or conference session, an average watch time of 40-60% of the total session duration is strong. Interactive elements — polls, Q&As — consistently improve average watch time.
Q: Does Livebroadcasting.in provide post-event analytics reports?
Yes. All professional streaming packages include a post-event analytics report with key audience metrics, engagement data, geographic distribution, and benchmark comparisons where available.
